A1 Head Impact Study
How the Mid-360 / D435 head mount holds up to sensor g-loads and to knocks from the front, top, side and corners, how five print materials compare, what the Rev B changes (3.5 mm hood walls, pad-step and pocket fillets) bought, and how much the filler adds when it is in contact. Impact results are given per kilonewton so they scale directly.
Findings
Energy to first yield in PA12: top 0.47 → 1.13 J, side 0.64 → 1.41 J, face-plant 1.45 → 3.70 J. Deflection roughly halved.
A rigid filler shares corner loads: the bottom corners go from 0.6–0.8 J to 2–6 J before the plate yields, and the weakest case of all rises from 0.61 to about 1.6 J.
Face-plant and head-on loads peak where the D435 and lidar pads meet. Rev C widens the rib there from 4 to 6 mm; not yet re-analysed.
For the mount. For the filler, MJF PA12 or FDM PETG at 40–50% infill; solid TPU works as a cushion but concentrates load on the hood wall ends.
Rev A → Rev B
Energy the head absorbs before first yield, MJF PA12, for every impact case. Longer bars are better.
Corners: 1 kN on the rounded outer corner of the hood, pushing diagonally inward and back. Right is the lidar side, left the D435 side (seen from the front).
Adding the filler
The same Rev B mount with the filler bonded to it, so it carries load from the first contact. Four fillers compared, the mount in MJF PA11. Loads now land where hits actually arrive: the front face of the filler, and its rounded collar corners. Bars show the energy the head absorbs before the mount first yields. Longer is better.
Bonded is the best case: with a clearance gap the filler only joins in once the hood has flexed. Rev C tightens the fit to 0.2 mm to get close to it. Stresses here come from element integration points, which are not averaged across the plate and filler, so they sit a little below the node values used elsewhere in this report; compare within this chart.
The filler itself
A rigid filler usually yields before the mount does. PA12 first yields at the mouths of the bottom insert bores, where the bonded model bridges the hole; PETG at 25% infill crushes locally (strength taken as about 10 MPa). That is harmless for the sensors, since a crushing filler absorbs energy, but the linear model cannot follow what happens after it. Solid TPU at 1 kN is stretched far past the range a linear model represents, so treat its numbers as indicative.
Materials, Rev B
Energy before first yield by material. The TPU cover (or the dome guard, head-on) acts as a spring in series with the structure, so a stiffer material builds up more force from the same hit. Corner panels show the weaker of the two corners.
Dashed line: a trip into an obstacle at walking pace, estimated at 3.5 J. A nose-down tip-over from standing is estimated at 8.6 J, off this scale. Both are rough; the legs and knees usually take much of a real fall.
Sensor g-loads, Rev B
Lidar (265 g), camera (72 g), filler and cover (123 g) and the plate's own mass at 100 g. Bars show the safety factor in the worst direction; the dashed line marks a factor of 2.
Worst direction is forward for every material: the sensors pull on their screws. Down improved from 4.2× to 7.4× in PA12 with Rev B.
Where the stress goes, Rev B
Von Mises stress on the deformed shape, deflection exaggerated. Impact cases share one colour scale per kilonewton; the g-load case has its own.
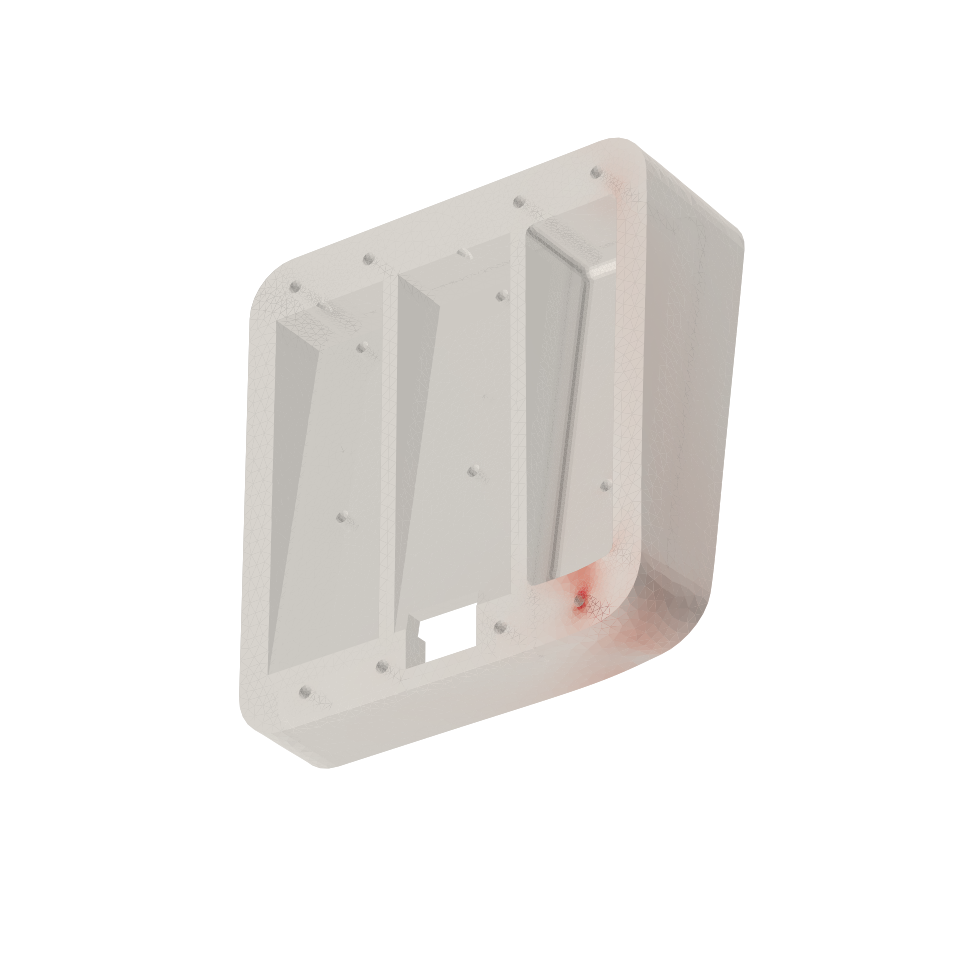
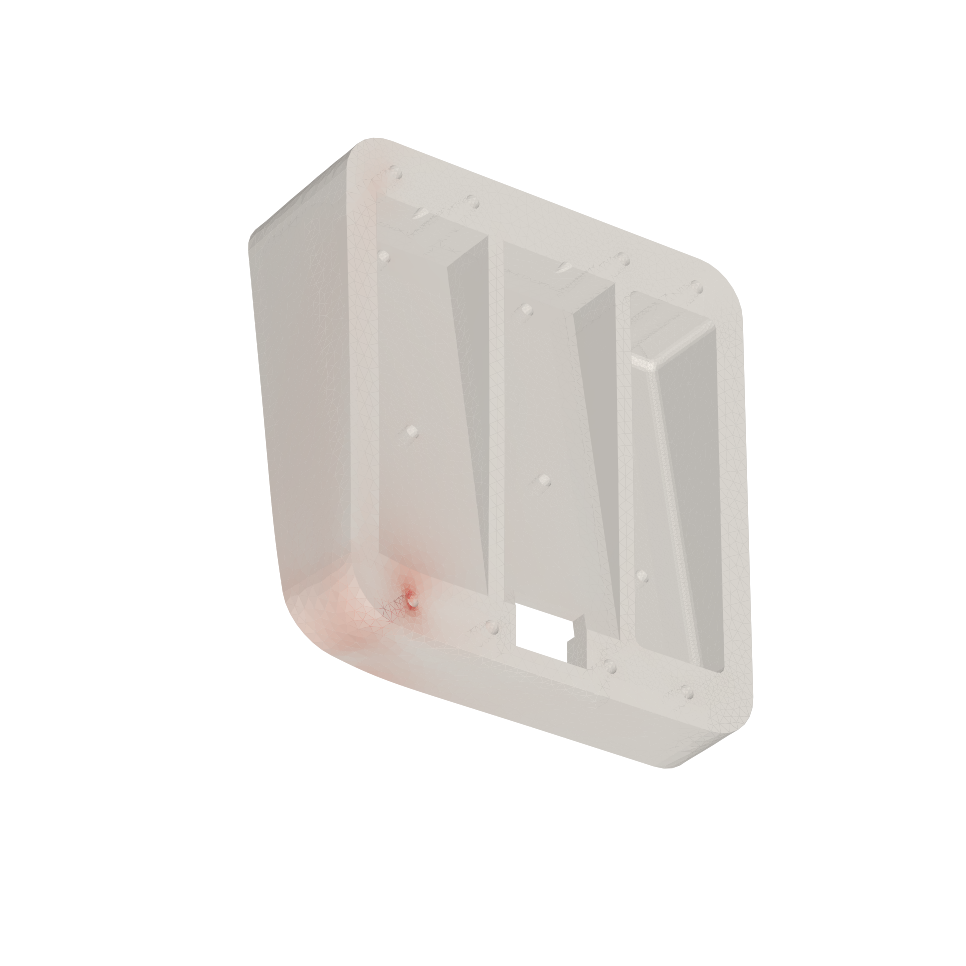
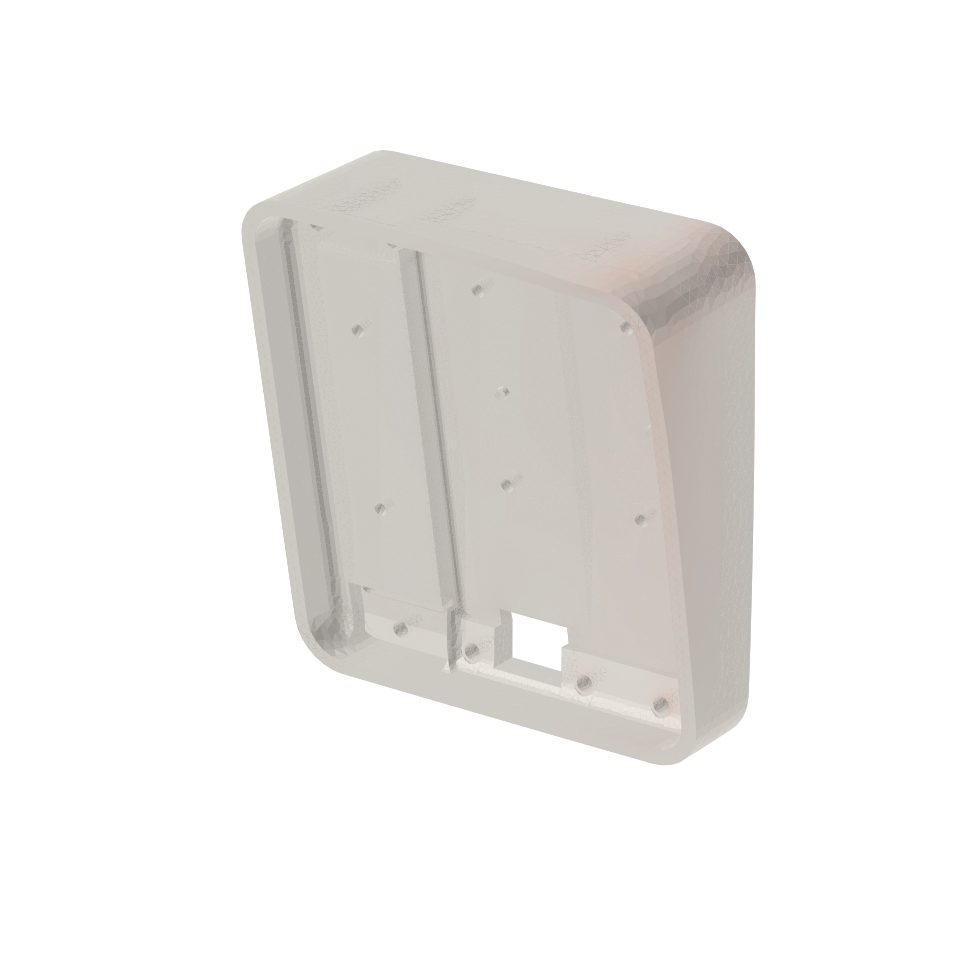
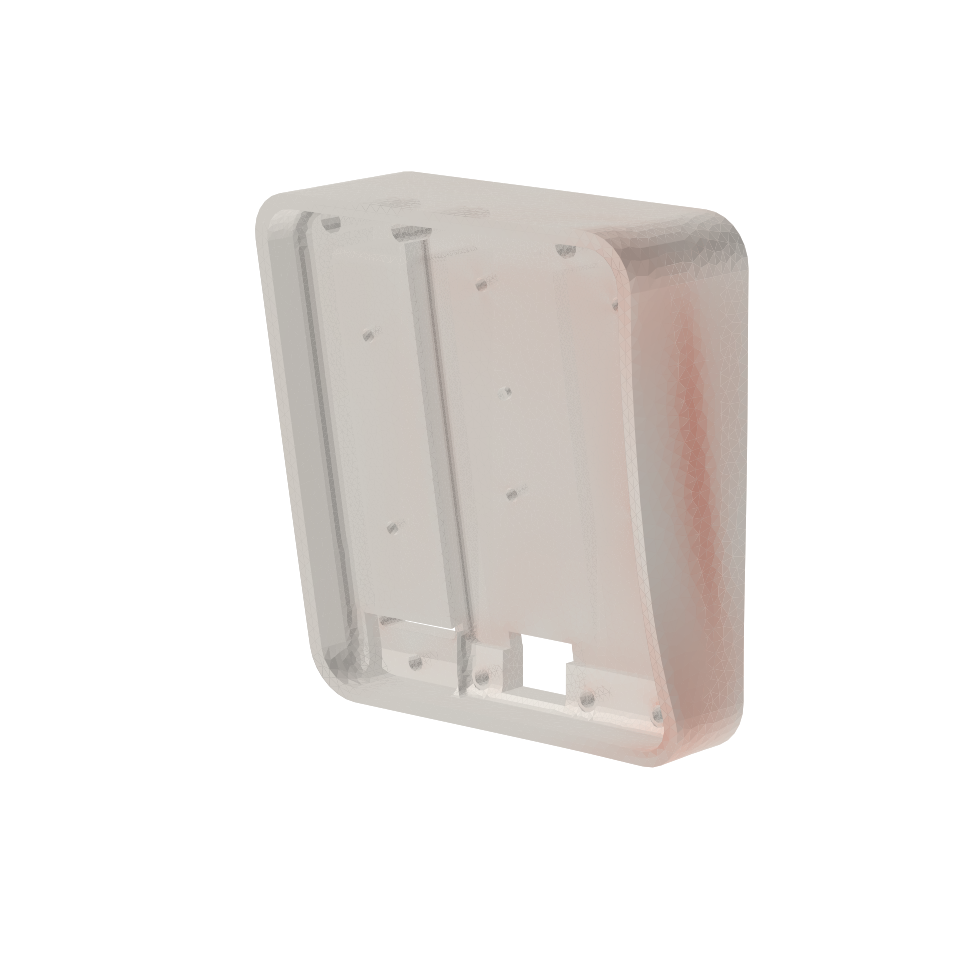
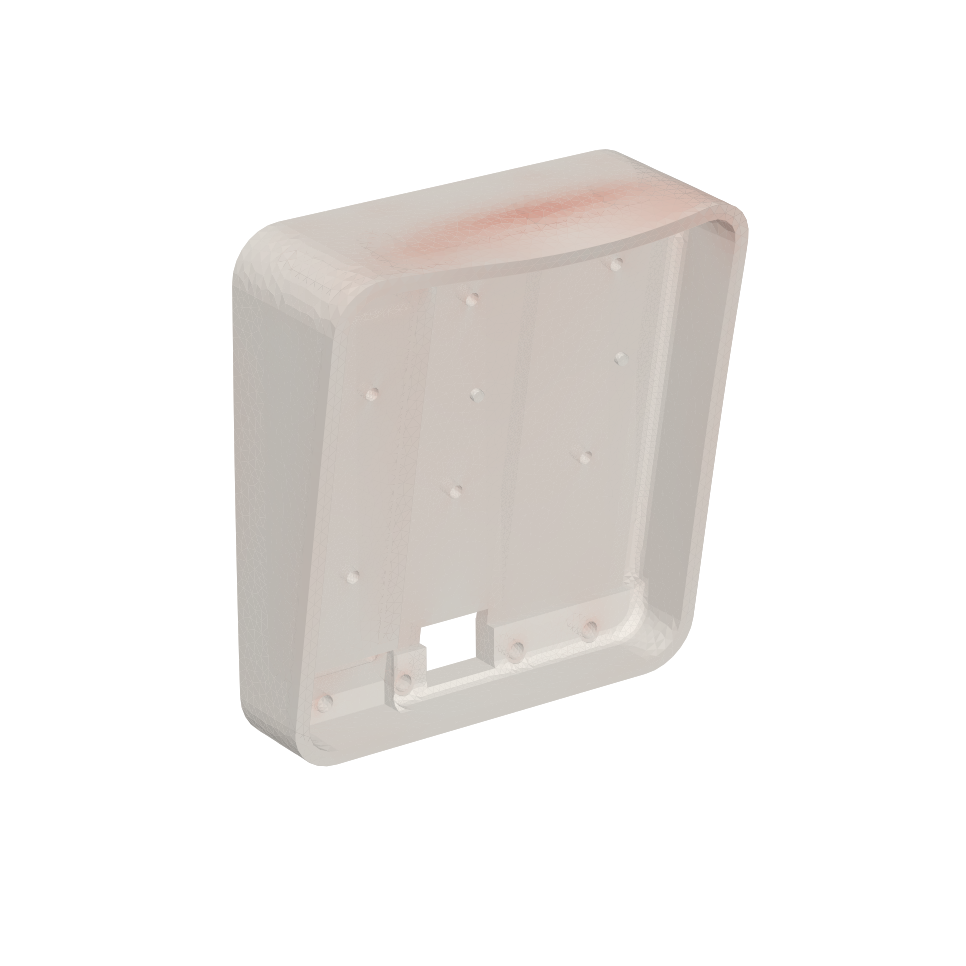
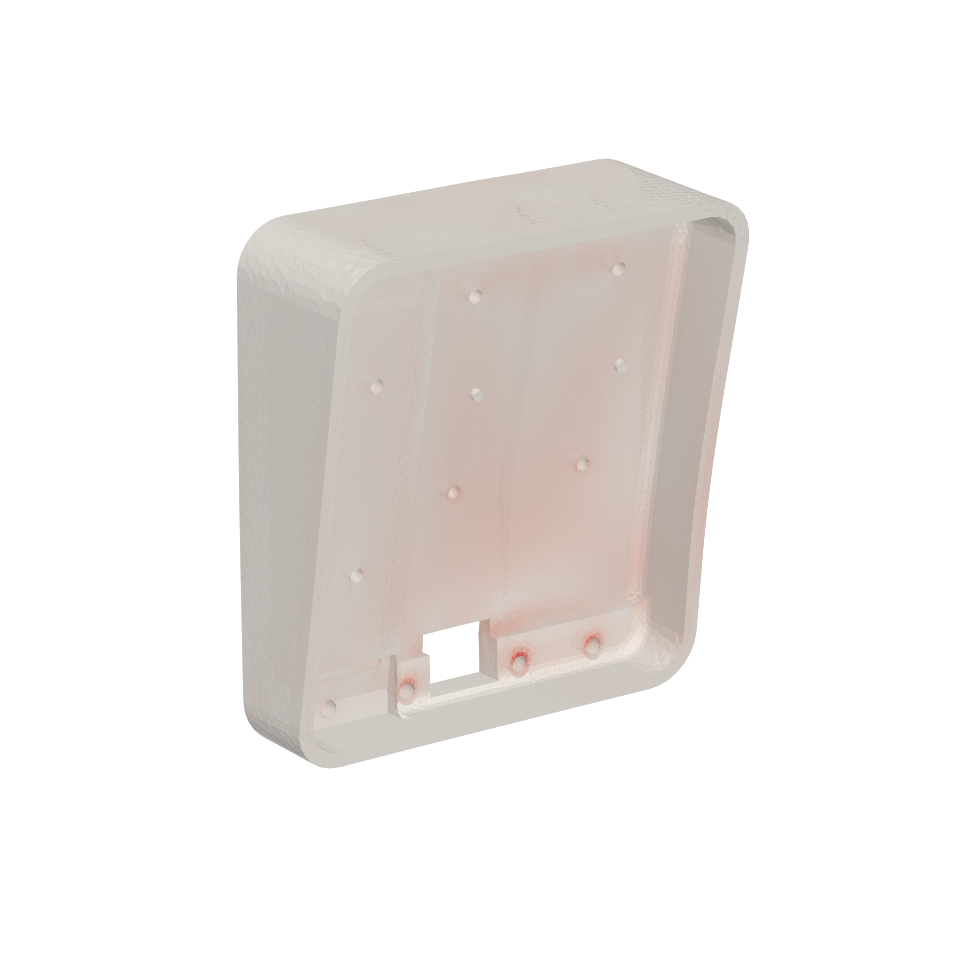
Stress values exclude the 1.5 mm right at the insert supports, where a perfectly rigid support gives an artificial spike (up to 58 MPa per kN at the bottom corners). Deflections are for MJF PA12.
Numbers
Peak stress per case, Rev A vs Rev B (MPa, PA12 deflection in mm)
Rev B: force at first yield (kN) and energy (J)
Rev B: safety factor at 100 g
Materials as modelled
Status and next steps
- Rev C, done: the rib between the D435 and lidar pockets is 6 mm (was 4), and the filler fits the hood and plate with 0.2 mm clearance (was 0.4) so it joins in almost immediately. It keeps 0.4 mm around the sensors so it still slides over them. All design checks pass and the STLs are updated.
- Verify Rev C. The wider rib targets the face-plant and head-on hot spot; a re-run of those cases would confirm the gain.
- Filler material: MJF PA12, or FDM PETG at 40–50% infill. Both share corner loads and crush gracefully if overloaded.
- Mount material: MJF PA11 or PA12. FDM PA-CF, PETG and PLA reach first yield at roughly half the energy or less, and PLA cracks rather than bends.
- Brackets: TPU 95A with metal compression sleeves adds a large extra cushion (check it doesn't upset the camera calibration), or rigid PA11 as a replaceable weak link.
Limits of this analysis
- Linear static only. Real impacts are dynamic, and nylons keep absorbing energy after first yield, so the energy figures are conservative for PA11 and PA12 and close to breaking point for PLA.
- The head is held only at its 8 inserts, fully bonded. On the robot the back face also bears on the brackets, which takes much of any load pushing the head backward. That matters most for the corner cases, so the bottom-corner web stress is an upper bound.
- Impact forces come from estimated energies and contact stiffness (TPU 95A over a 20 × 20 mm patch, 3.7 kN/mm; dome guard 1 kN/mm).
- FDM materials use their across-layer strength, since the hood walls print upright and bend across the layers.
- The body brackets, filler and TPU cover are not modelled structurally. Material values are typical datasheet figures, not measurements of your prints.